
*This feature allows users to have a graphical representation of module summaries on dashboard.
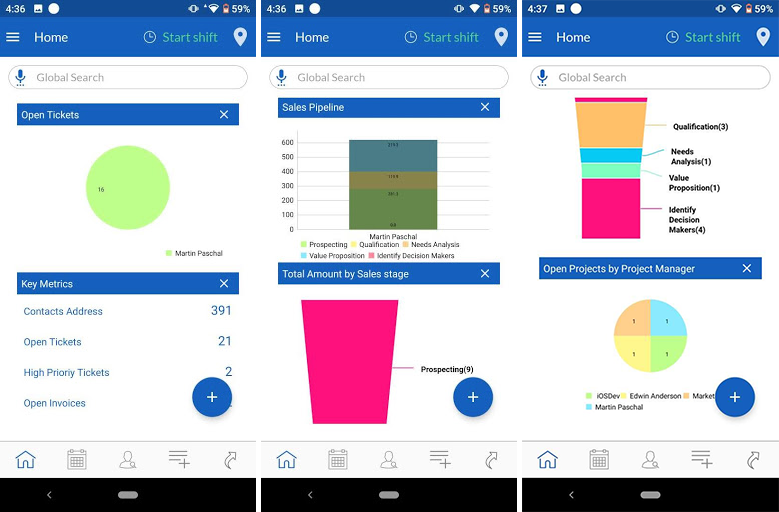
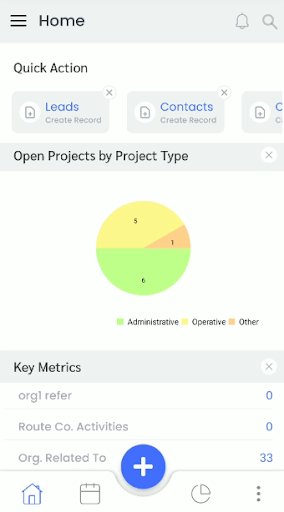
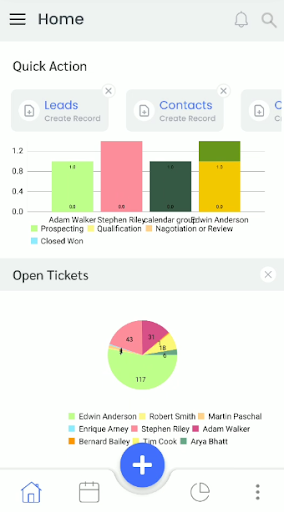
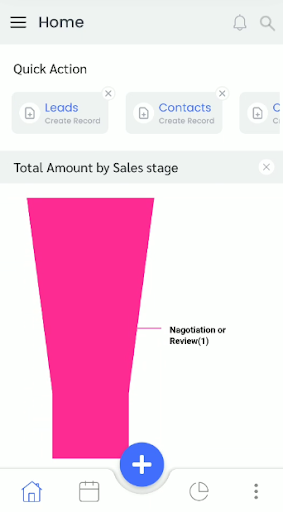
Admin Settings – There are two types of Dashboard graph display on Home page of Mobile Apps
- Default Home Page Widget : In Web CRM of vTiger There is option in Dashboard called Add Widget, Graph or option those that are displayed in Add widget will be added to Mobile Apps Dashboard.
- Chart Pin to Dashboard from Report Module : From Web CRM -> Reports module All Reports with Type Chart and Report set to “Pin to Dashboard” will be displayed as Chart in Dashboard of Mobile Apps.